Numerous publicly available Earth Observation maps provide data on forests, land use, and tree cover. However, these maps often differ because they use various definitions and classification systems. As a result, no single map can provide a complete picture of any specific area. To address this issue, the Forest Data Partnership (FDaP) and the AIM4Forests Programme advocate for the Convergence of Evidence approach.
This method involves:
- Using multiple data sets instead of relying on just one
- Combining information to gain a more detailed understanding of a particular area
- Reducing the impact of potential errors or biases in individual data sources
By analysing several data sets together, stakeholders can build a more accurate picture of what’s likely happening in a given location. This approach provides a more comprehensive and reliable view of forest and land use changes over time.
The analysis consists of extracting zonal statistics (counting relevant pixels) from a series of public datasets for a set of polygons (a plot of land). The geospatial analysis is presented in a tabular form where each GeoID is a unit of information.
The types of datasets reported on are categorized as follows:
- A. forest and tree cover at the end of 2020;
- B. deforestation before and after 2020;
- C. crop plantations and other agricultural uses;
Whisp is developed under the AIM4Commodities programme - Accelerating Innovative Monitoring for Forests and Commodities.
Key Features
 User-friendly interfaces optimized for technical and non-technical users.
- Digital public infrastructure
- Supporting Deforestation Compliance
- Transparent Supply Chains
- Downloadable analysis-ready data (CSV or GeoJSON)
- Open-source nature with all code available on GitHub
Digital Public Infrastructure prototype
What is a Digital Public Infrastructure?
A set of technology building blocks powered by interoperable open standards/specifications operated under a set of enabling rules with open, transparent, and participatory governance to drive innovation, inclusion, and competition at scale.
Boundaries
- Field data
- Digitized manually
- Segmentation
Unique Geo-IDs
- GDSP compliant
- Anonymous
- Attribute-less
Public Geodata
- Land cover
- LC Change
- Biophysical
- Land use
Public Models
- AI models
- Decision trees
Compliance Support
- Standardized data
- Risk assessment at the plot level
Designed For
Whisp is for everyone along the commodity supply chain, from smallholders, cooperatives, third parties, and operators, to governments and relevant authorities
Smallholders
Simply use your mobile app to capture your farm boundaries. Open Foris Ground automatically generates your GeoID(s), which seamlessly travels down the commodity supply chain.

Cooperatives
If you already have farm boundaries from your farmers but without GeoIDs, you can easily upload them into the Whisp API using the user interface.

Governments, third parties, operators
Easily use your own maps by customising the Source Code, adapting the process and layers as needed.

Architecture & Ecosystem

Ecosystem
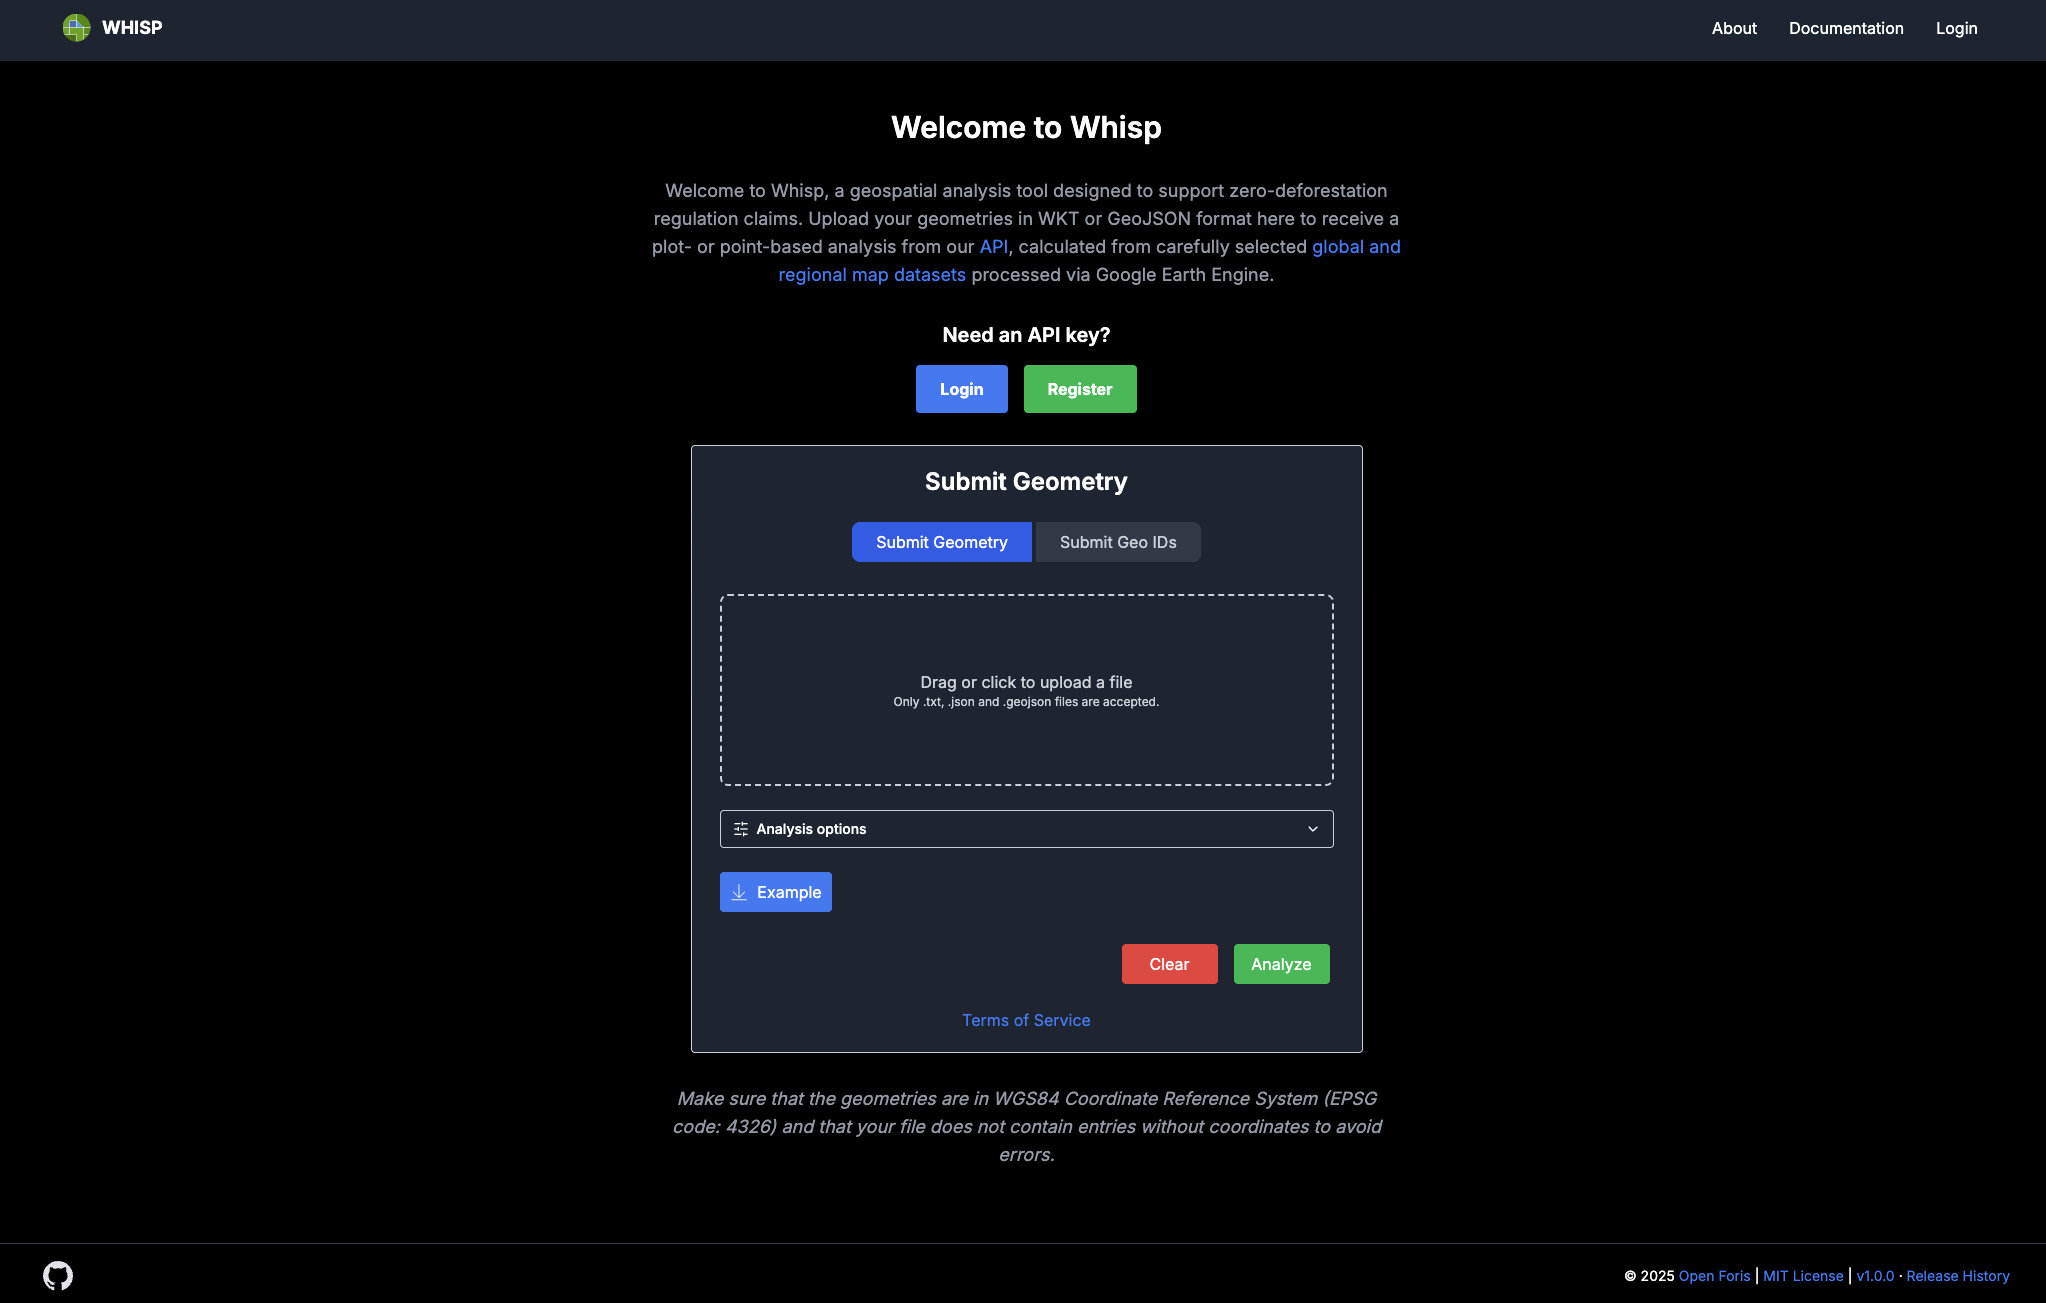
Whisp is an application programming interface (API) to extract statistics for plots of land. With the Whisp API, you can input your geometries and receive a dataset that will take your original input, process it, and return a comprehensive analysis for each individual plot identified. The data can either be uploaded to the API through a graphical user interface (GUI) or you can call the API directly via HTTP requests. The code is publicly available on GitHub, and can be inspected, reproduced and adapted. It is designed by FAO.
Access the Whisp API to register your plot data and generate GeoIDs.
The Whisp source code is written in Python and can be executed as Jupyter Notebooks. The notebooks provide added flexibility to run tailored analyses and modify input data layers. The functions stored here are used to run the core analysis behind the other solutions in the Whisp ecosystem. External contributions to the source code can be provided through pull requests on GitHub.
Access and analyze various public geodata layers.
To enable smallholders to produce monitoring data, any mobile app that collects geolocated field geometries can integrate with the Whisp process, such as the TechnoServe or Open Foris Ground apps. This enables smallholders to generate comprehensive information on their mobile devices in a few steps. Open Foris Ground has already implemented Whisp within its application.
The Whisp QGIS plugin streamlines deforestation risk analysis by enabling users to submit their selected geometries directly from QGIS to the OpenForis Whisp API. It processes these inputs by integrating multiple global data layers using a Convergence of Evidence methodology, providing spatial risk assessments returned as GIS layers for visualization and further analysis within QGIS. This workflow facilitates rapid, data-driven risk assessment without leaving the QGIS environment. Installation is straightforward through the official QGIS Plugin Repository or GitHub.
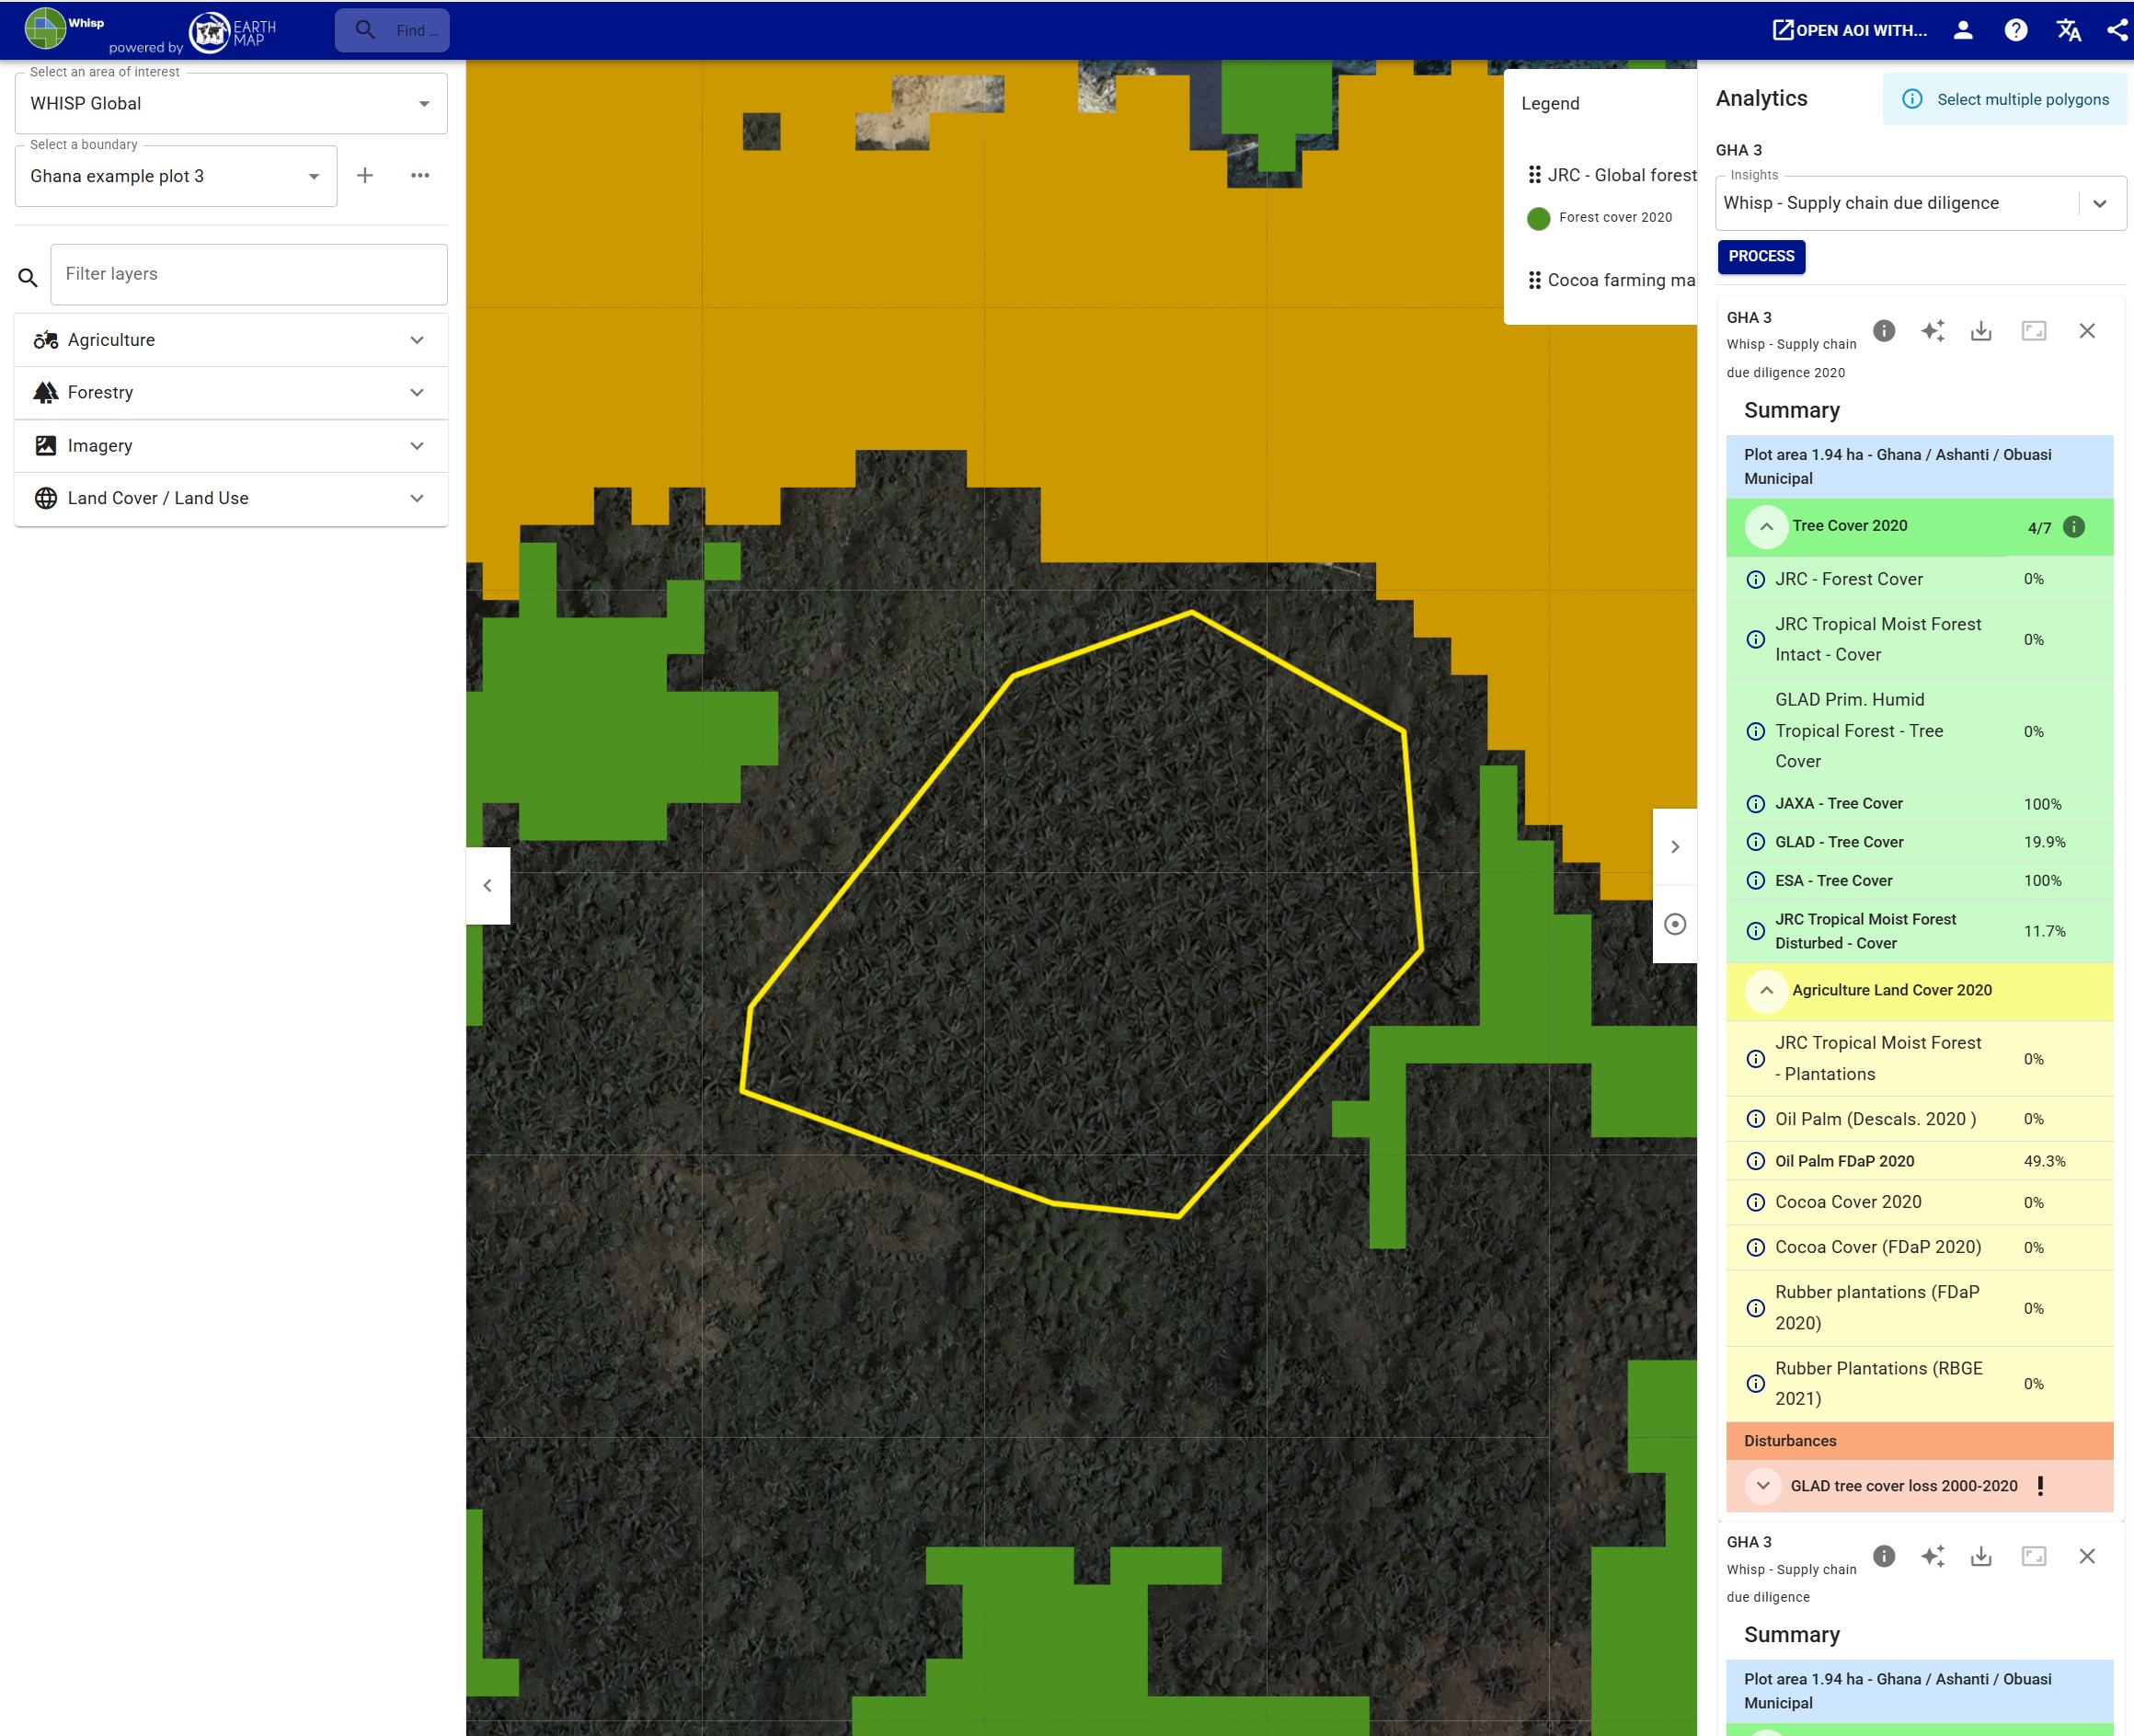
WhispMap is a visualisation tool where you can upload your geometries. It provides an intuitive interface for comprehensive geospatial analysis, making it easier for users to manage and explore their data efficiently. WhispMap is designed for easy demonstration and visualization. Users can draw shapes on the screen, input AgStack-generated geoIDs, or explore different data sources.
Access Whisp Map and visualize individual polygons to better understand plot-level activities.
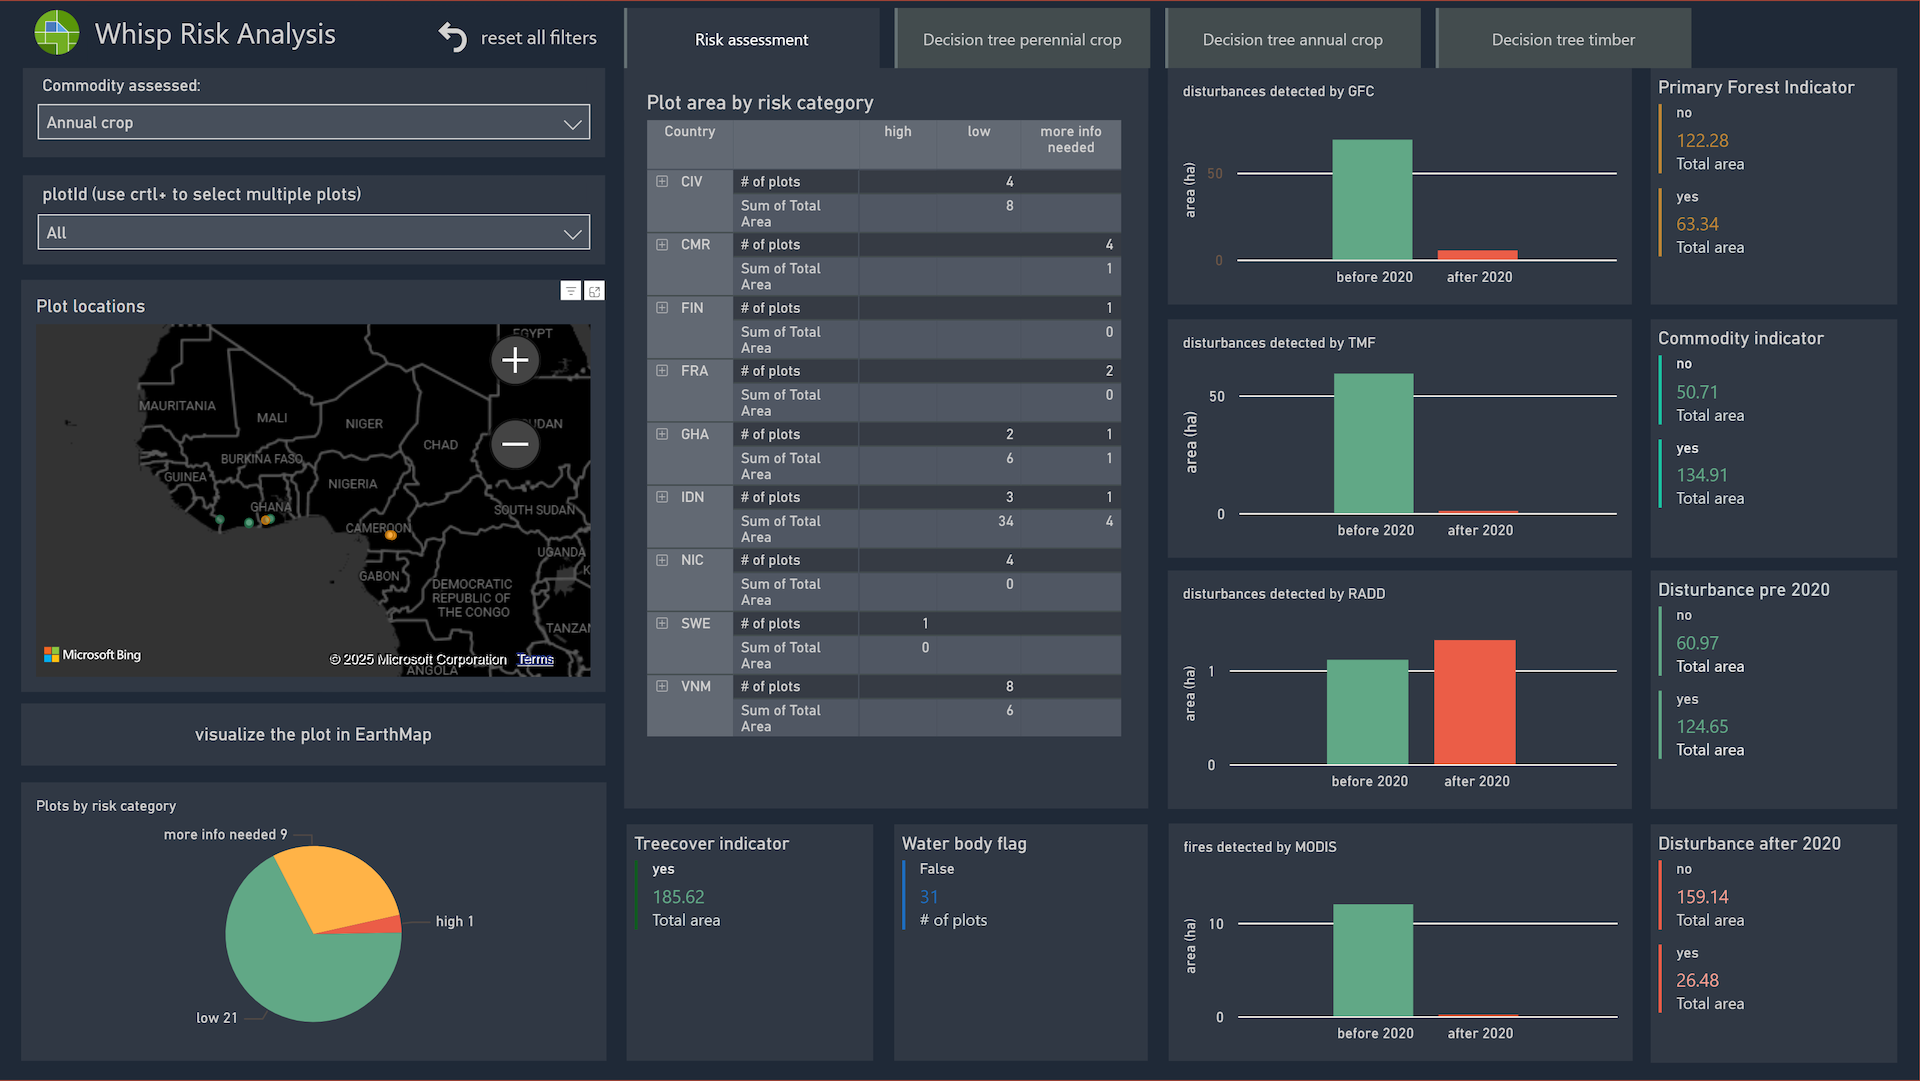
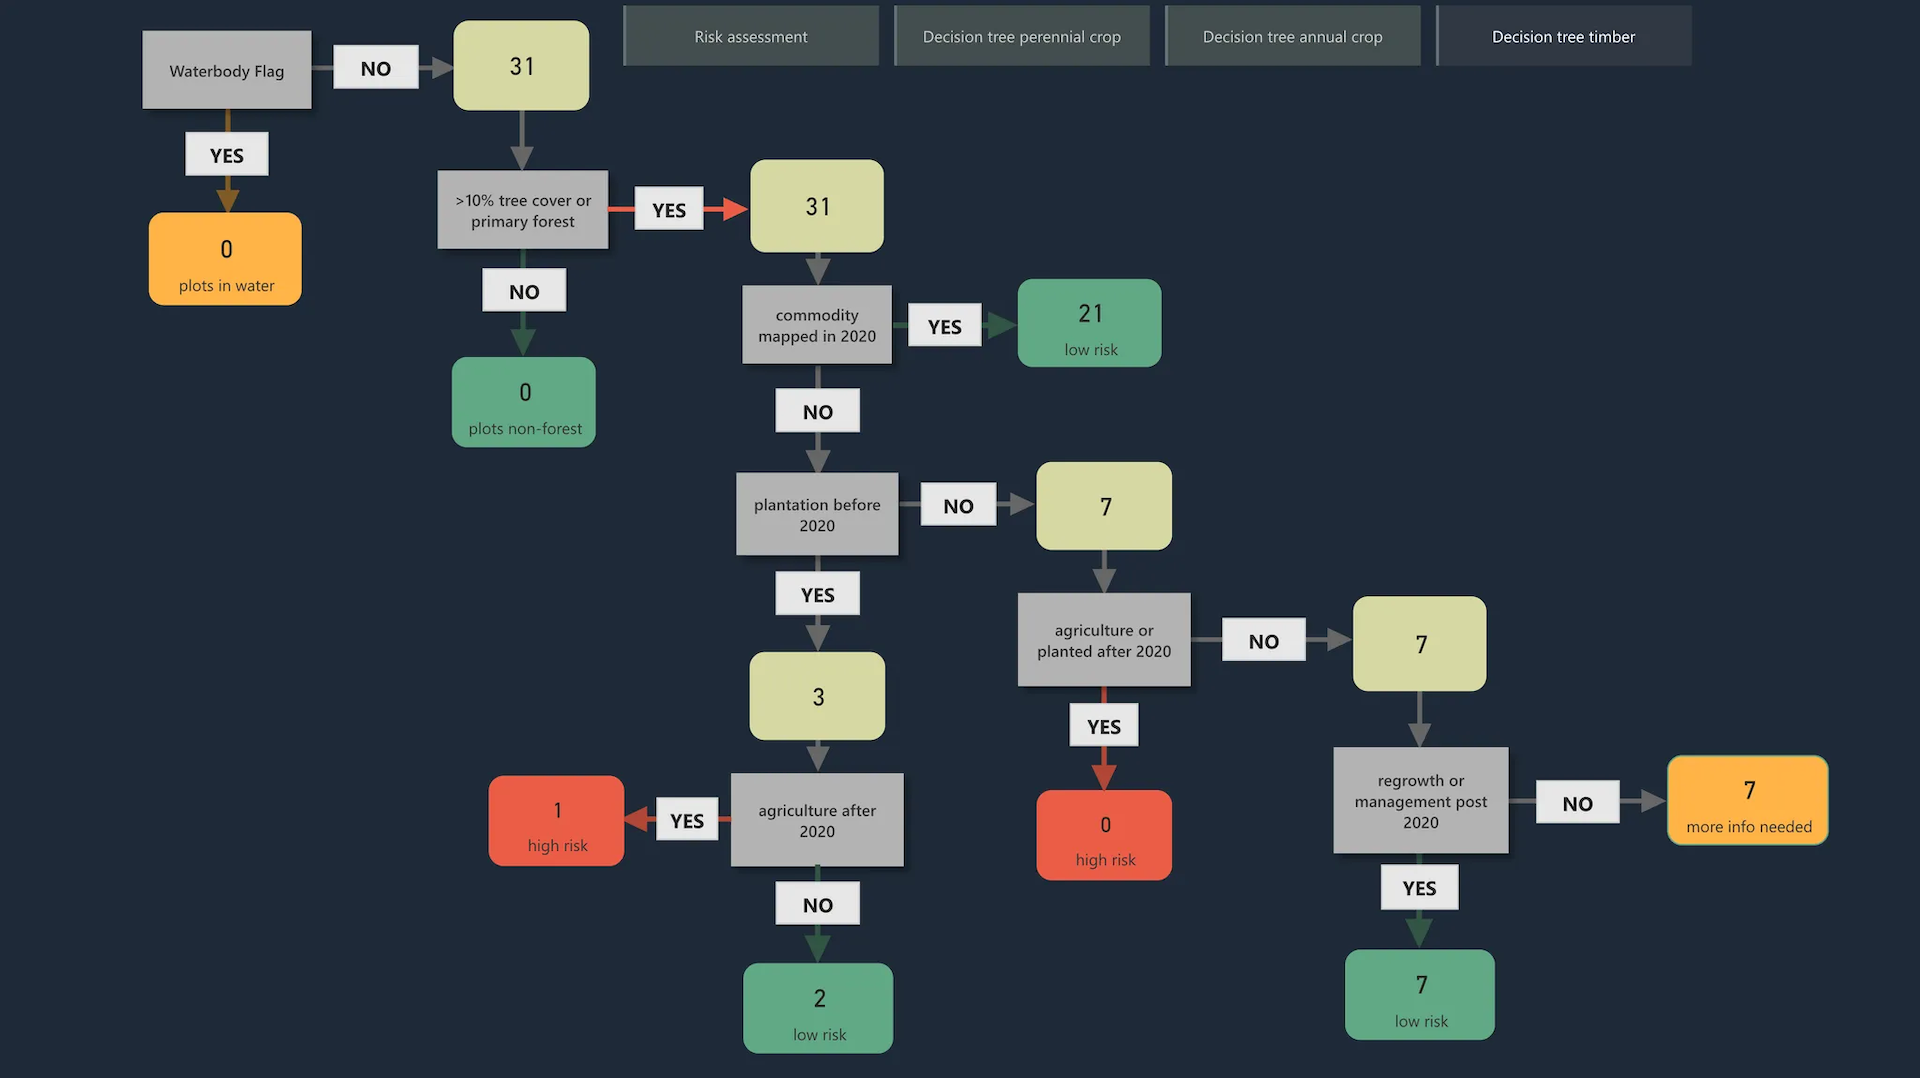
The deforestation risk analysis uses information generated by Whisp to classify plots of land into three risk levels:
- Low Risk: any plot outside of mapped forest, overlapping with an available commodity map or with any observed disturbance map before 2020.
- High Risk: plot is within mapped forest, not within any mapped commodity, and only disturbances detected after 2020
- More information needed: plots that have not been disturbed or lack other evidence to determine their risk level. This classification highlights areas that require further investigation.
Whisp outputs can be analysed and visualised in the provided dashboard templates to allow users to quickly summarise and query risks, assess specific criteria, and view their plots in WhispMap.
Download the dashboard via the Forest Data Partnership’s GitHub.
A tableau public version is also available.
Technology Stack
- Framework: Next.js 14.2.26 with React 18
- Language: TypeScript 5.8.2
- Styling: Tailwind CSS with custom components
- UI Components: Radix UI component library
- Mapping: Leaflet 1.9.4 with react-leaflet 4.2.1
- State Management: Zustand 4.4.7
- Data Tables: TanStack Table 8.20.1
- File Handling: react-dropzone 14.2.3
- Runtime: Node.js with Next.js API routes
- Database: PostgreSQL with pg driver 8.14.1
- Authentication: JWT tokens via jose 6.0.10
- Email: Nodemailer 6.10.0 for verification/reset
- Python Integration: Subprocess execution
- API Documentation: Swagger UI React 5.21.0
- Logging: Winston 3.15.0
- Core Library: openforis-whisp for risk assessment
- Data Processing: pandas, numpy for data manipulation
- Geospatial: Google Earth Engine API